

You did it. You successfully built a cohesive, integrated marketing and sales machine using GoHighLevel (GHL). The forms are live, the workflows are humming, the calendars are booked, and the sales pipeline is set up. But where most marketers get lost is right here: proving that all that hard work translates into profit.
The biggest mistake is focusing on vanity metrics—page views or social followers—which don't prove ROI. This final guide is your Rosetta Stone: it will show you how GHL's built-in reporting instantly links every click and conversation directly to a dollar value, allowing you to shift your focus to the conversion metrics that matter most.
Here is a preview of the GHL reporting and analytics features covered in this article.
Feature: Built-in Reporting & Analytics Dashboard
The GoHighLevel (GHL) platform natively solves the critical question of proving system effectiveness by providing built-in reporting features that shift focus away from vanity metrics to conversion metrics, linking every action directly to a measurable dollar value.
- Reporting & Analytics: An integrated dashboard that demystifies system performance, allowing you to link marketing activities directly to sales outcomes.
- Conversion Metrics Focus: Shifts measurement away from meaningless "vanity metrics" (page views, social followers, email open rates) to actionable results that prove ROI.
Benefits:
- Prove System ROI: Directly link clicks and conversations to a dollar value, finally answering the question of whether your system is making you money.
- Identify Performance Bottlenecks: Easily see where leads are dropping off in your funnels, pipelines, and workflows, allowing for continuous, targeted optimization.
- Make Data-Driven Decisions: Stop guessing and start using accurate, built-in data to continuously optimize the entire customer journey for maximum efficiency and conversion.
Practical Outcome:
By leveraging GHL's native reporting capabilities, you will transform your marketing operation into a data-driven machine, giving you the power to prove system performance and continuously refine your customer journey to maximize sales and revenue.
The Scorecard: Sales & Pipeline Metrics
The main GHL Dashboard is your sales and operations center. It answers the fundamental question: How healthy is our sales process?
1. Opportunity Value and Pipeline Bottlenecks
GHL's Pipeline Report is more than just a list; it’s a living financial forecast.
- Metric: Total Pipeline Value: This shows the aggregated value of every lead currently sitting in your pipeline stages. You should monitor this daily.
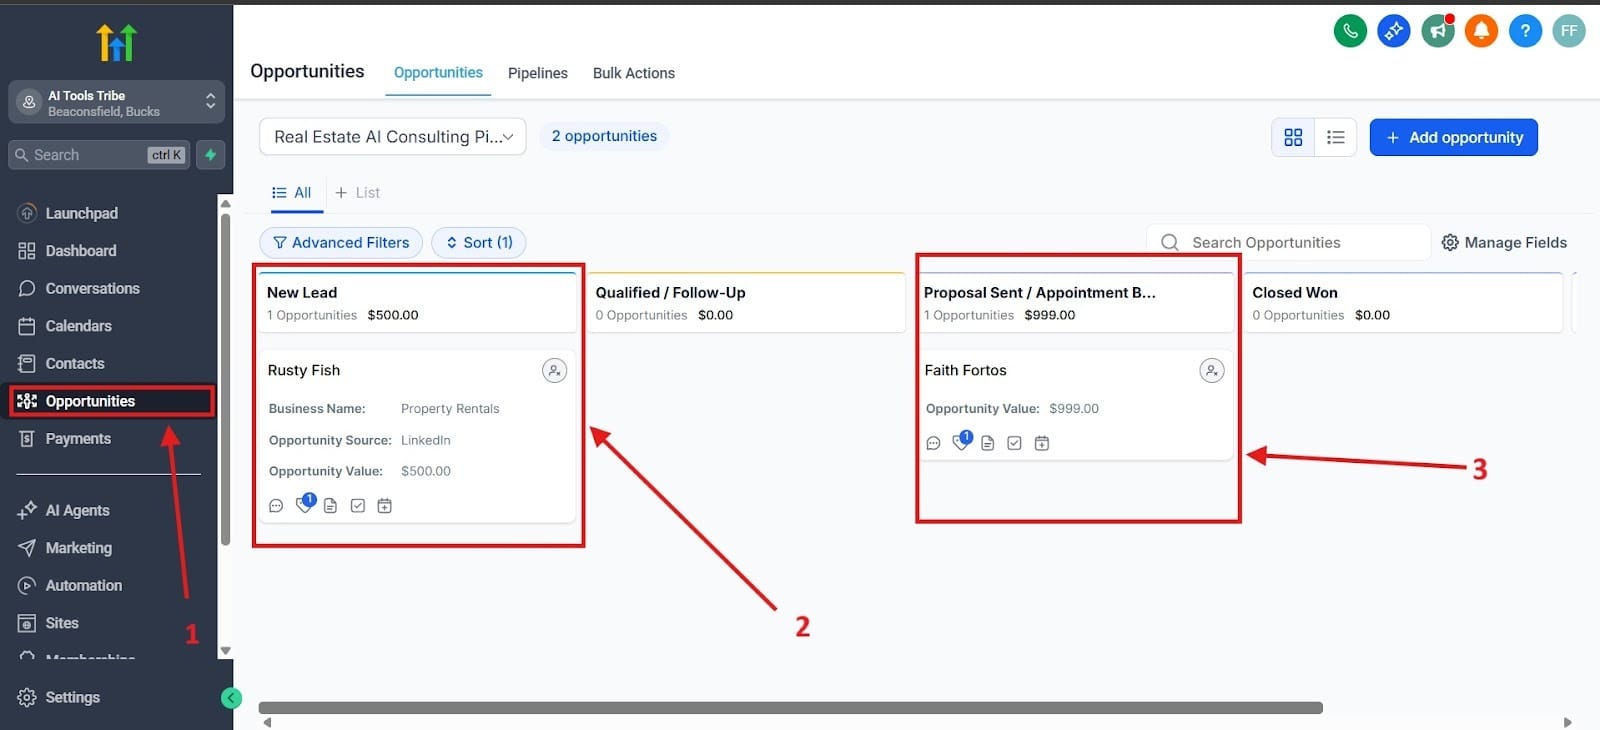
- Actionable Insight: If your total pipeline value is consistently high, but you aren't closing many deals, you have a conversion issue. Look at where the opportunities are stalling. If most value is stuck in the "Proposal Sent" stage, your pricing, offering, or sales pitch need more refinement.
Below you see an image of what the pipeline would look like. To get there, you would want to click on the Opportunities section found on the left highlighted as red box one. Red box number 2 shows you the value of your lead and where they are in the pipeline. Red box number 3 shows you the value of a prospect, but it also shows you where you’re at with having sent out a proposal.
2. Conversation Rates
The Conversation Rate (or stage-to-stage conversion rate) is arguably the most valuable metric for process improvement.
- Metric: Stage Conversion: This measures the percentage of leads that successfully move from one stage to the next (e.g., from "New Lead" to "Appointment Booked").
- Actionable Insight: Identify the weakest link in your entire system. If the conversion rate from "Appointment Booked" to "Appointment Showed" is low, your confirmation workflows (like the ones we built in Post 5) are failing. You need to add more value, better reminders, or more friction to the booking process to filter out non-serious leads.
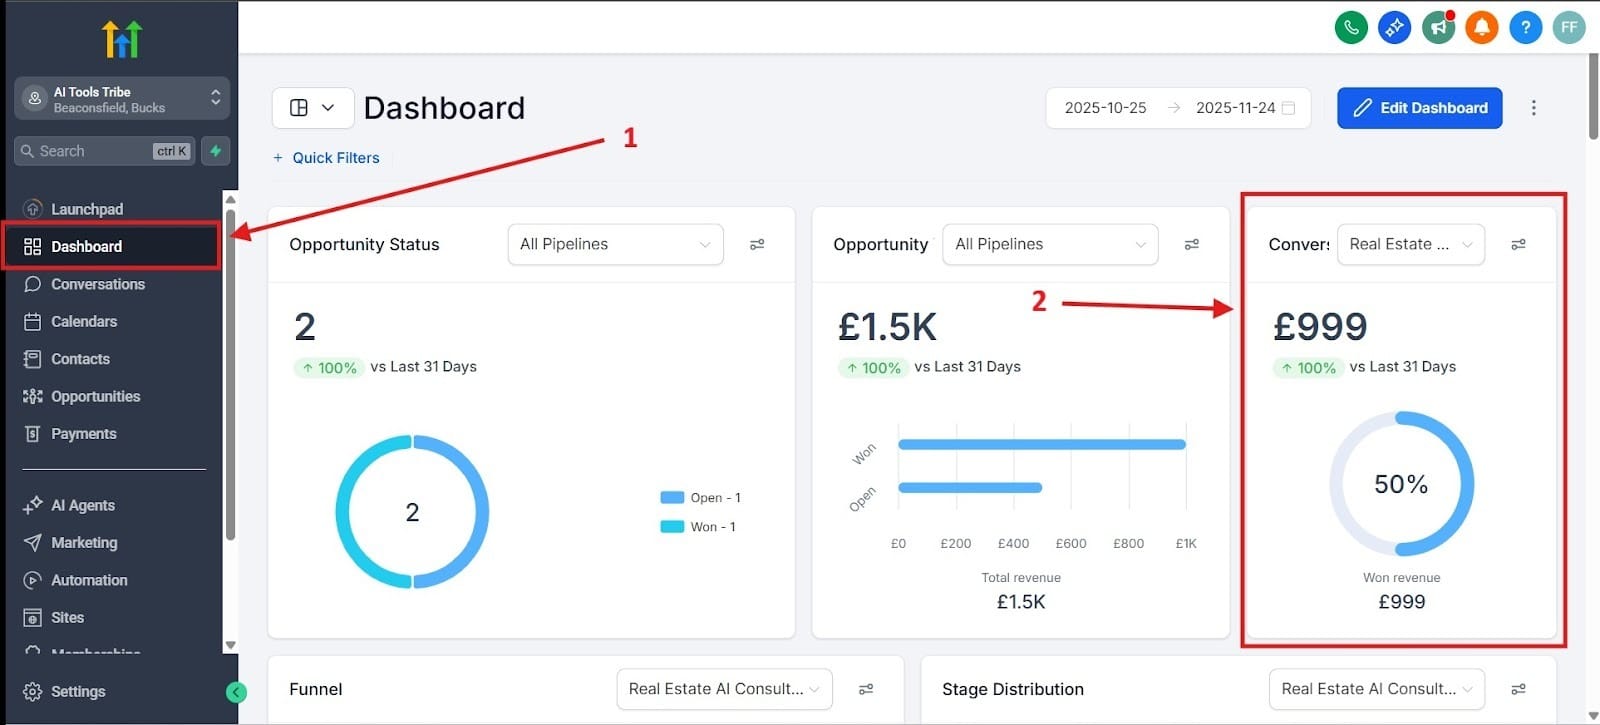
Red box number 1 shows you where to get to the Dashboard. Here you can see your conversion rate. I highlighted where to see the conversion rate with red box number 2.
3. Manual Activity Report
This report is essential for team management and ensuring your sales reps are following the process.
- Metric: Tracks completed actions: Calls made, texts sent, emails replied to, and notes added.
- Actionable Insight: Are your sales reps hitting their activity targets? If follow-up activity drops, the conversion rate from the "Warm Lead" stage will inevitably drop 30-60 days later. This report provides an early warning signal for future revenue problems.
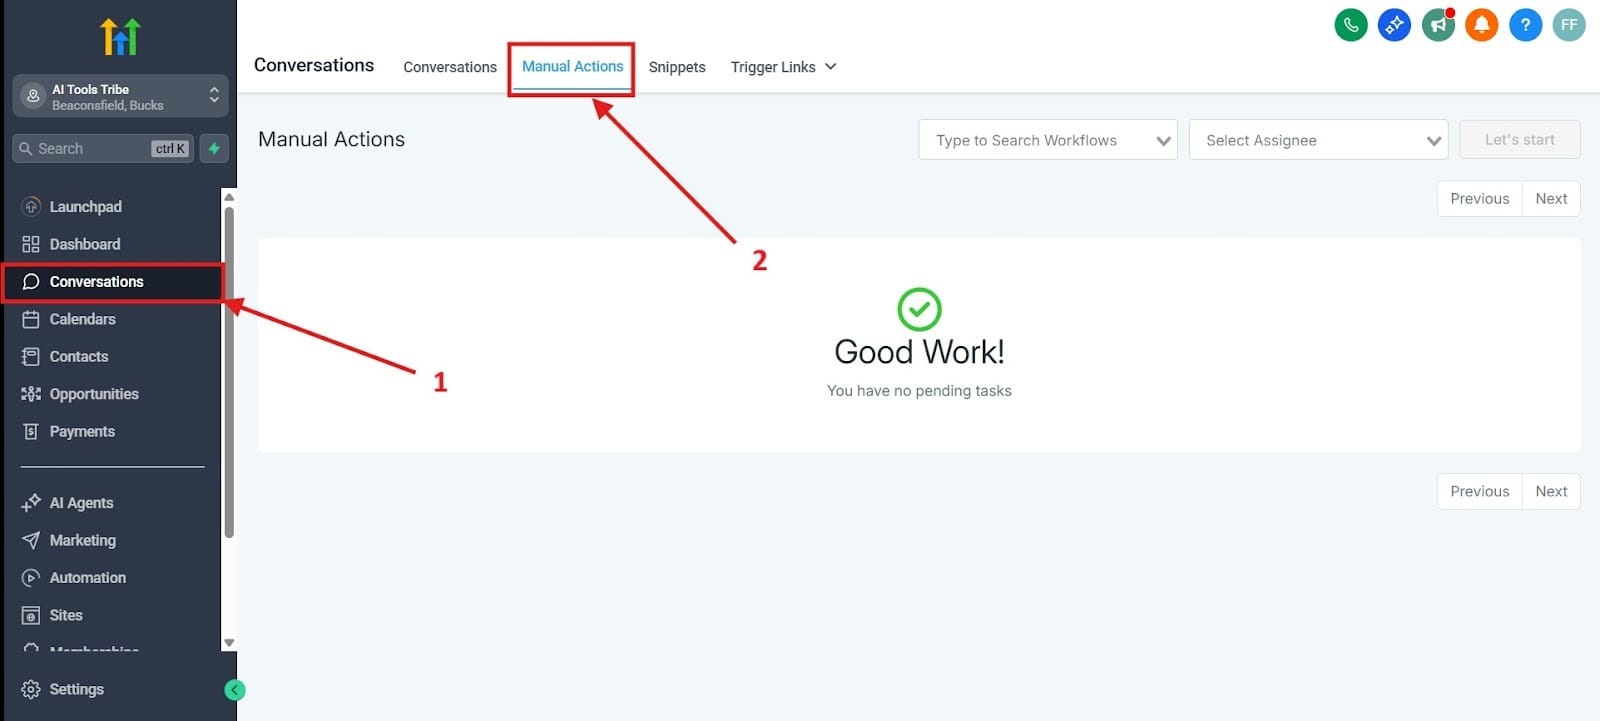
To get to the manual activity area, first look in the side tab that says Conversations, which I highlighted as number one. Next, look for the section that says, Manual Actions. This was highlighted as number two.
The GPS: Attribution Reporting - Where Did the Money Come From?
This is where marketing teams prove their worth. Attribution reporting connects the revenue you make to the source of the traffic, allowing you to stop guessing and start scaling what works.
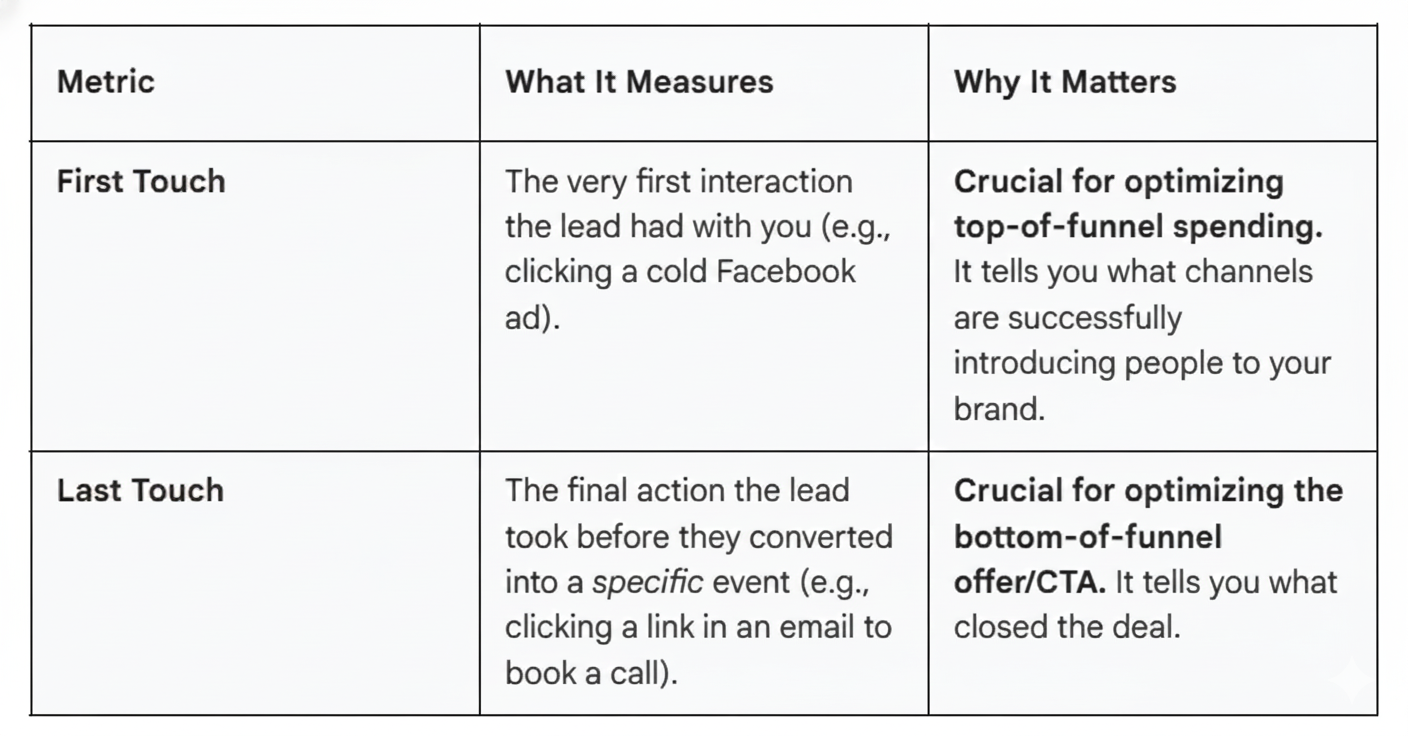
1. Understanding First Touch vs. Last Touch
GHL automatically attributes leads based on their interactions. You need to look at both attribution models to understand the full customer journey.
2. The Sources of Leads Report
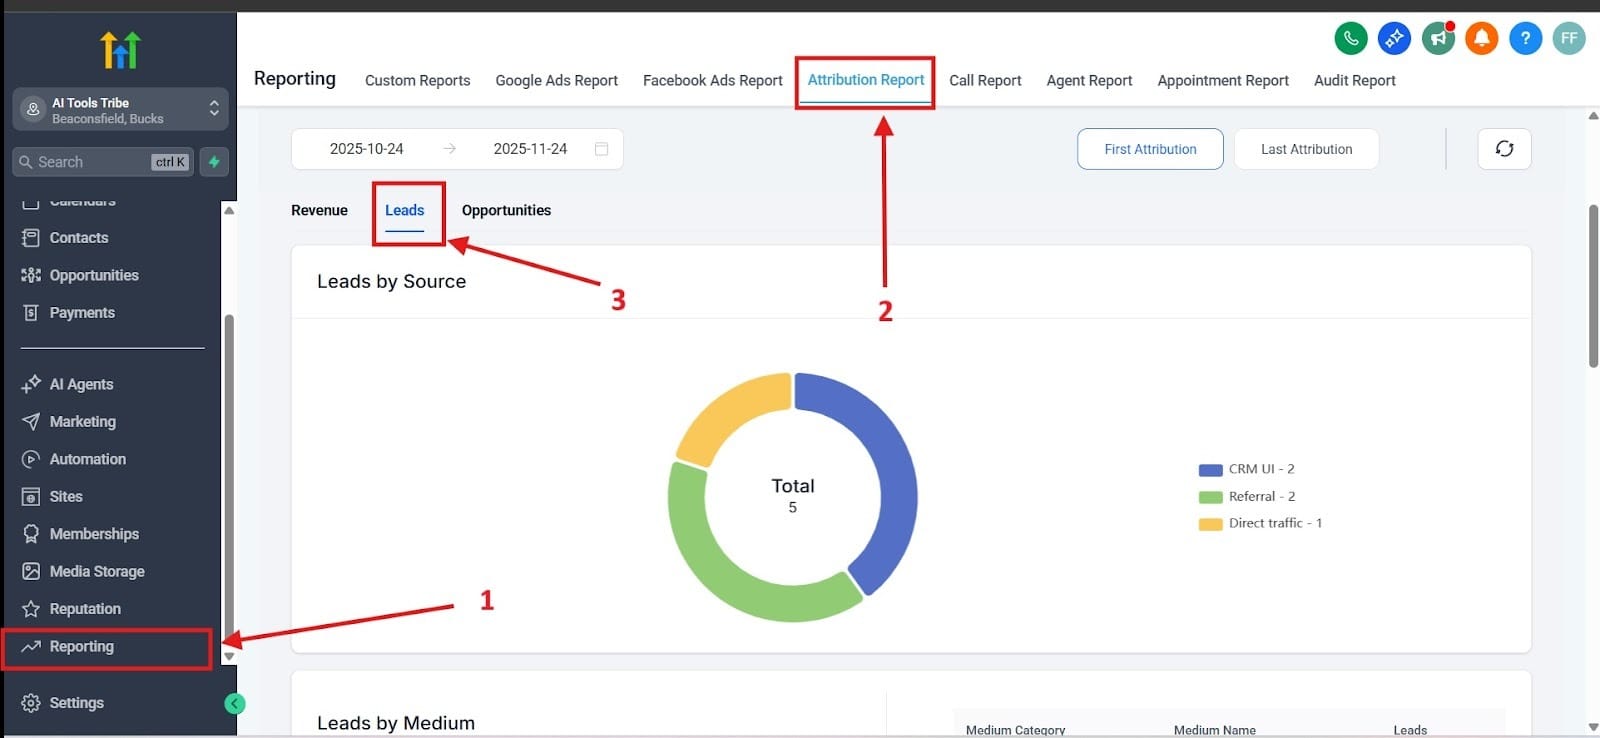
This report provides a clear visual breakdown, usually a pie chart, showing the percentage of your new opportunities that originated from different sources (Organic Search, Social Media, Paid Ads, Direct Traffic, etc.).
- Actionable Insight: This is the most direct way to prove ROI for marketing channels. If the "Organic Search" slice of the pie is responsible for 70% of your qualified (not just raw) leads, you should immediately invest more time and resources into your content strategy. If "Facebook Ads" delivers high volume but low quality that never progresses past "New Lead," you need to stop or dramatically adjust that ad spend.
For the first step, go to Reporting outlined in red as number one. For the second step, go to the Attribution Report, outlined in red as number 2. For the final step to see the source of your leads as a pie chart, go to Leads highlighted in red as number 3.
The Optimization Engine: Turning Data into Action
Data is useless unless you act on it. GHL facilitates a continuous feedback loop that allows you to automate, measure, and refine your system instantly.
1. Connecting Ad Spend to Revenue
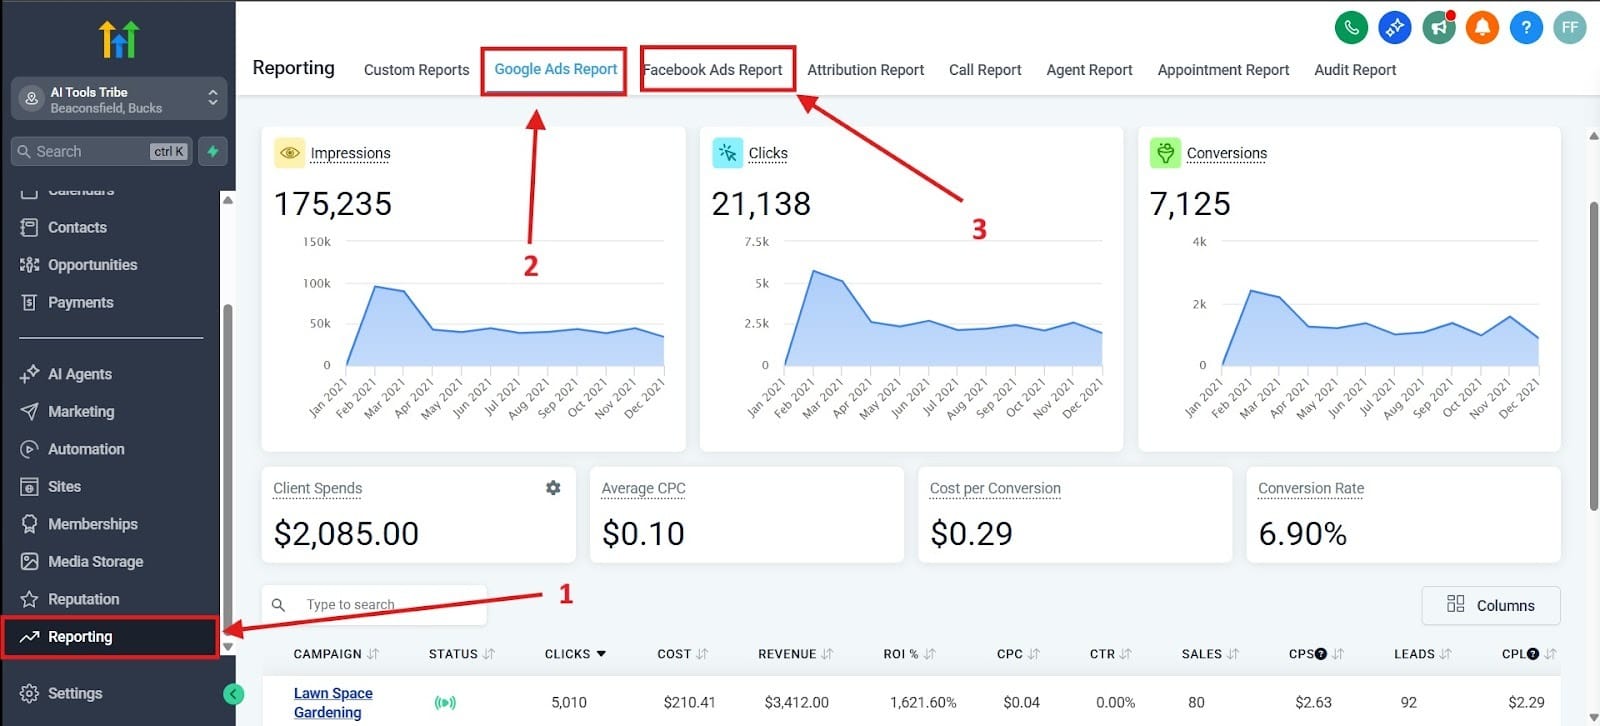
GHL's integrated reporting for Google Ads and Facebook Ads is far more powerful than the native ad platforms:
- The Loop: Native ad platforms show you Cost Per Lead (CPL). GHL reports show you the Cost Per Appointment Show or Cost Per Sale.
- Actionable Insight: You may find an ad campaign with a fantastic CPL that generates cheap, tire-kicking leads who never show up for their appointment. GHL helps you link that ad spend directly to the actual revenue it generates, allowing you to pause poor-performing ads that only create busywork for your sales team.
To get to this page, you must scroll down to the bottom of the lefthand menu to reach Reporting. I highlighted this as number one.
Next, you can either choose to view your Google Ads Report or your Facebook Ads Report. While I highlighted them as two and three, either one is acceptable without order to click on.
2. The Continuous Optimization Cycle
Use this four-step cycle to constantly refine your GHL machine:
- Analyze: Find a weak point in the Conversation Rate report (e.g., Appointment Show Rate is 50%).
- Hypothesize: The confirmation process is weak. Leads are forgetting to attend.
- Test: Go into your Workflows and add a new action: an SMS reminder 15 minutes before the appointment, plus a final email with the virtual meeting link.
- Measure: Check the report next week. If the rate increases to 70%, you’ve just significantly boosted revenue without increasing ad spend.
3. Custom Dashboards
Finally, use GHL to make the data view based on the user's role:
- For Sales Reps: Create a dashboard focused only on Manual Activity and their personal Pipeline Value.
- For Marketing Managers: Create a dashboard focused on Attribution, Sources of Leads, and Ad Performance.
- For Owners/Executives: Create a dashboard focused on Total Revenue Closed and the Pipeline Value (the financial forecast).
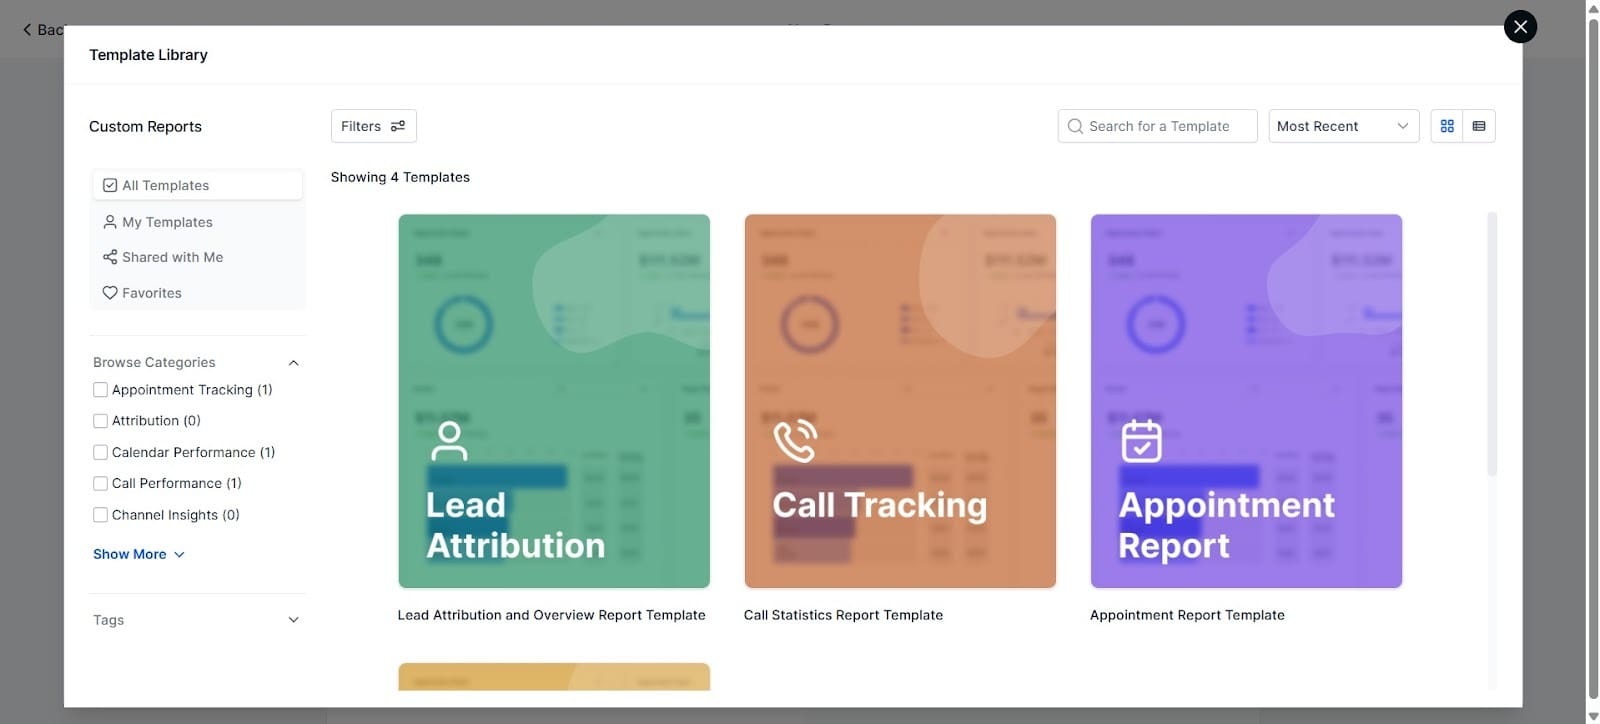
This part is found in the Reporting section. Go to Custom Reports and click on New Report. Once there, you can either choose to create a blank report or choose from a template from the library. For first-timers, I would recommend that you pick one from the library. You have four templates to choose from, which I highlighted in the image below.
Beyond Tracking, Toward Prediction
Now you’ve completed the build. You now have a unified system where every action, from a website click to a closed sale, is measurable.
The GoHighLevel system is not a set-it-and-forget-it automation platform, it is a continuous feedback loop. Use these reports to constantly audit your workflows, improve your messaging, and scale the marketing efforts that truly deliver revenue.
You are no longer guessing what works. You are managing a predictable, data-driven revenue engine.
Check Out The Other GoHighlevel (GHL) Articles:
What is GoHighLevel?
Stop Losing Leads: How to Build Your First High-Converting Lead Magnet Funnel in GHL
End the Email Back-and-Forth: Master GHL Calendars for Zero-Friction Appointment Booking & Reminders
The Solopreneur's Quickstart Guide to GHL CRM: Pipeline Setup & Smart List Organization That Converts
Scaling Your Success: Mastering Client and Team Management in GHL
